# Monitoring Agents & LLM Token Usage

<div id="early"><div class="note-border alert-important">
  <div class="alert alert-important" role="alert">
    <div><i class="far fa-exclamation-circle"></i></div>
    <div class="alert-text">
      <p><strong>Important</strong>: The functionality described on this page is only available to customers who have licensed Veeva AI.</p>
    </div>
  </div>
</div>

</div>
Vault offers multiple methods to track and monitor usage and performance of agents, agent actions, and LLM tokens. You can use this information to analyze agent performance and understand token consumption amongst agent actions.

## Monitoring Agent Instance & Action Execution

You can monitor the usage of agents and agent actions via the _Agent Instance_ and _Agent Action Execution_ objects in **Business Admin > Objects**. _Agent Instance_ and _Agent Execution Action_ records are created each time an agent action is executed. _Agent Instance_ and _Agent Action Execution_ records older than 60 days based on their creation date are deleted on a weekly basis. This deletion occurs even if the record is referenced on another object.

### Agent Instance Object

_Agent Instance_ records contain details on the agent that initiated an agent action and information on the document or record where the agent action was initiated. For example, if an agent action was executed on a document, you can view the document's _Document Type ID_, _Document ID_, and _Document Type Label_. The user who initiated the agent action is assigned as the _Owner_ of the _Agent Instance_ record. In addition, you can view general details on the agent, such as the _Agent Label_, _Agent State_, and _Connection ID_.

The _Connection API Name_ field displays the API _Name_ of the LLM connection associated with the agent. For example, a Veeva AI Advanced connection displays `veeva_ai_llm__sys`. You can use this information to build reports that identify specific LLM connections. You may need to add the _Connection API Name_ field to the record's layout.

### Agent Action Execution Object

_Agent Action Execution_ records contain specific details on the agent action, such as the _Agent Action Label_, _Execution Status_, and _Execution Time_. Each record contains a link to the _Agent Instance_ record associated with the agent action.

The following _Agent Action Execution_ object fields are important to note:

* _Input Tokens_, _Output Tokens_, and _Total Tokens_: These fields represent the total amount of tokens consumed by the agent action. Each field takes into account all requests related to the agent action's execution, such as agent tool calls and retries due to a failed agent tool call. In some cases, these fields may not populate a value when the _Agent Action Execution_ record is initially created and pending execution.
* _Execution Start Date_: UTC date and time the agent action execution was initiated. In some cases, this date and time may differ from the record's _Created Date_.
* _Effective Date_: UTC date and time the record is ready for aggregation in the _Daily Agent Action Activity_ object. The _Effective Date_ is not populated until the _Execution Status, Input Tokens_, _Output Tokens_, and _Total Tokens_ fields contain a value. In some cases, the time in the _Effective Date_ may differ from the _Execution Start Date_ time.

## Monitoring Daily Agent & Agent Action Activity

The _Daily Agent Activity_ and _Daily Agent Action Activity_ object records are created daily based on the UTC time zone of the _Effective Date_ in the _Agent Action Execution_ object. For example, agent and agent activity for October 3 is summarized in the daily activity objects if the _Effective Date_ is between _10/03/2026 00:00:00 UTC_ - _10/04/2026 23:59:59 UTC_. These records are available in **Admin** > **Business Admin**.

Vault never deletes _Daily Agent Activity_ and _Daily Agent Action Activity_ records as opposed to the 60-day limit of _Agent Instance_ and _Agent Action Execution_ records.

### Daily Agent Activity

_Daily Agent Activity_ records summarize daily agent activity and combine certain details from the _Agent Instance_ and _Agent Action Execution_ records. For example, the _Input Tokens_ field is pulled from the _Agent Action Execution_ record. You can use the _Daily Agent Activity_ records to review and analyze specific agent activity within a day, such as number of agent instances that occurred and the total number of tokens used.

In addition, you can use the _Connection API_ and _Connection Label_ fields to analyze and track token usage by LLM connection. For example, you can break down token usage by Veeva AI-provided LLM and custom-created LLM connections.

### Daily Agent Action Activity

_Daily Agent Action Activity_ records provide summarized details on all agent actions executed within a day. For example, you can view the median and average execution time, the 90th percentile of execution time, and the total number of successful and failed agent action executions.

<div class="note-border alert-info">
  <div class="alert alert-info" role="alert">
    <div><i class="far fa-info-circle"></i></div>
    <div class="alert-text">
      <p><strong>Note</strong>: Agent monitoring and activity details, such as token counts, only apply to active <em>Agent Instance</em>, <em>Agent Action Execution</em>, <em>Daily Agent Activity</em>, <em>Daily Agent Action Activity</em> records. Vault sets these records to inactive if they are included in a sandbox Vault created or refreshed from a snapshot. Typically, these inactive records are deleted the day after the sandbox is created or refreshed if the record is present in the snapshot.</p>
    </div>
  </div>
</div>


## Tracing Agent Actions {#tracing-agent-actions}

Admins can initiate trace sessions that allow them to monitor details related to individual agent actions and the LLM requests involved in the agent action's execution. This level of monitoring is helpful when performing iterative tests and supports troubleshooting issues that cause agent actions to return inaccurate responses. Admins with the _Admin: Logs: Agent Traces_ permission can initiate trace sessions on themselves from [Veeva AI Chat][0] or on individual users from the [Admin logs][1]. This permission also allows users to view custom agent instructions and objectives in the trace details. System and standard agent objectives and instructions are not displayed in the trace details.

At the end of each trace session, Admins can download a JSON trace details file that includes details on the agent actions executed and requests sent to the LLM. The trace details file can include information such as agent action and agent tool configurations, the agent tool type, agent tool assignments, and the agent action _Name_, objectives, and instructions. The _Details_ data, such as extracted document text and agent tool inputs, in the _Content Blocks_ section of the JSON trace details file is only visible to Vault Owners and Agent Instance Owners. Based on the type of content in the _Content Block_, the _Details_ data can also display agent context and agent tool calls and results.

The JSON trace details file uses the following structure:

* **Trace Session ID**: The _Trace Session ID_ refers to the group of agent actions executed during the trace session. The _Trace Session ID_ can be associated with a _Chat ID_ or the initiating agent action, such as Quick Check.
  * **Agent Action Traces**: Refers to the agent actions executed during the trace session. Each agent action and their requests are listed by an Agent Action Execution ID.
    * **Requests**: Refers to all the request information sent to the LLM during the agent action execution. This information includes details such as the Request ID, execution time, and maximum number of input and output tokens. The Request ID refers to the request or response from the LLM. The request may or may not have a conversation history. An agent action execution can include multiple requests, such as when an agent tool is used.
      * **Messages**: Refers to the agent action details sent to the LLM, such as the agent action instructions, objective, and context.
        * **Role**: Refers to the origin of the message. _System_ refers to the agent objective, _User_ refers to the Veeva AI Chat or agent tool request, _Assistant_ refers to the Veeva AI Chat or agent tool response.
          * **Content Blocks**: Refers to the type of content, summary, and details included in the message sent to the LLM.
            * **Content Type**: Refers to the type of content used in the request, such as `TEXT` or `FILE_REF`.
            * **Summary**: A message summarizing the content, such as _Agent Objective_, _Agent Action Instructions_, _Context_, or _Assistant Response_.
            * **Details**: Displays the text or file reference used in the message. For example, "I'm sorry, but I cannot respond to this request." may display for an _Assistant Response_ from Veeva AI Chat. Only the Agent Instance Owner and _Vault Owner_ can view this information for custom agent objectives and instructions. Otherwise, _Details_ displays "You cannot access this information".

<div class="note-border alert-important">
  <div class="alert alert-important" role="alert">
    <div><i class="far fa-exclamation-circle"></i></div>
    <div class="alert-text">
      <p><strong>Important</strong>: The format of the JSON trace details file is intended for troubleshooting agent action executions. Be aware that this format may change in future releases.</p>
    </div>
  </div>
</div>


### Executing Trace Sessions in Veeva AI Chat {#trace-session-veeva-ai-chat}

To initiate a trace session in Veeva AI Chat:

1. Open Veeva AI Chat in [Full View](/en/lr/950642/#full-view).
2. Select the **Start Agent Activity Trace** icon (<img class="inline" src="https://platform.veevavault.help/assets/images/trace-icon.png" alt="Trace Icon" style=" width: 30px;" />).
3. A yellow banner with the text "Trace started" displays at the top window. In addition, a _Tracing…_ icon displays (<img class="inline" src="https://platform.veevavault.help/assets/images/tracing-in-progress.png" alt="Trace In Progress" style=" width: 150px;" />) to show the session is in progress. Begin executing agent actions. You can only execute up to five agent actions per trace session. The trace session automatically ends if you execute over five agent actions.

4. After you have finished executing agent actions, click the stop button on the _Tracing…_ icon to stop the session.
5. Click **Download** in the _Agent Trace Activity_ dialog to download a JSON file of the trace session. This dialog displays the trace date and time and _Trace Session ID_.

<div class="note-border alert-important">
  <div class="alert alert-important" role="alert">
    <div><i class="far fa-exclamation-circle"></i></div>
    <div class="alert-text">
      <p><strong>Important</strong>: Trace sessions initiated from the Veeva AI Chat window are not stored in <strong>Admin</strong> &gt; <strong>Logs</strong> &gt; <strong>Agent Traces</strong>.</p>
    </div>
  </div>
</div>


### Executing Trace Sessions from Admin Logs {#trace-session-admin-log}

Admins with the _Admin: Logs: Agent Traces_ permission can initiate trace sessions for specific users from **Admin** > **Logs** > **Agent Traces** pages. To initiate a trace session for a specific user:

1. Navigate to **Admin** > **Logs** > **Agent Traces**.
2. Click **Create**.
3. Enter a **Name** for the trace session.
4. Select a user from the **Trace for User** drop-down.
5. Click **Save**.

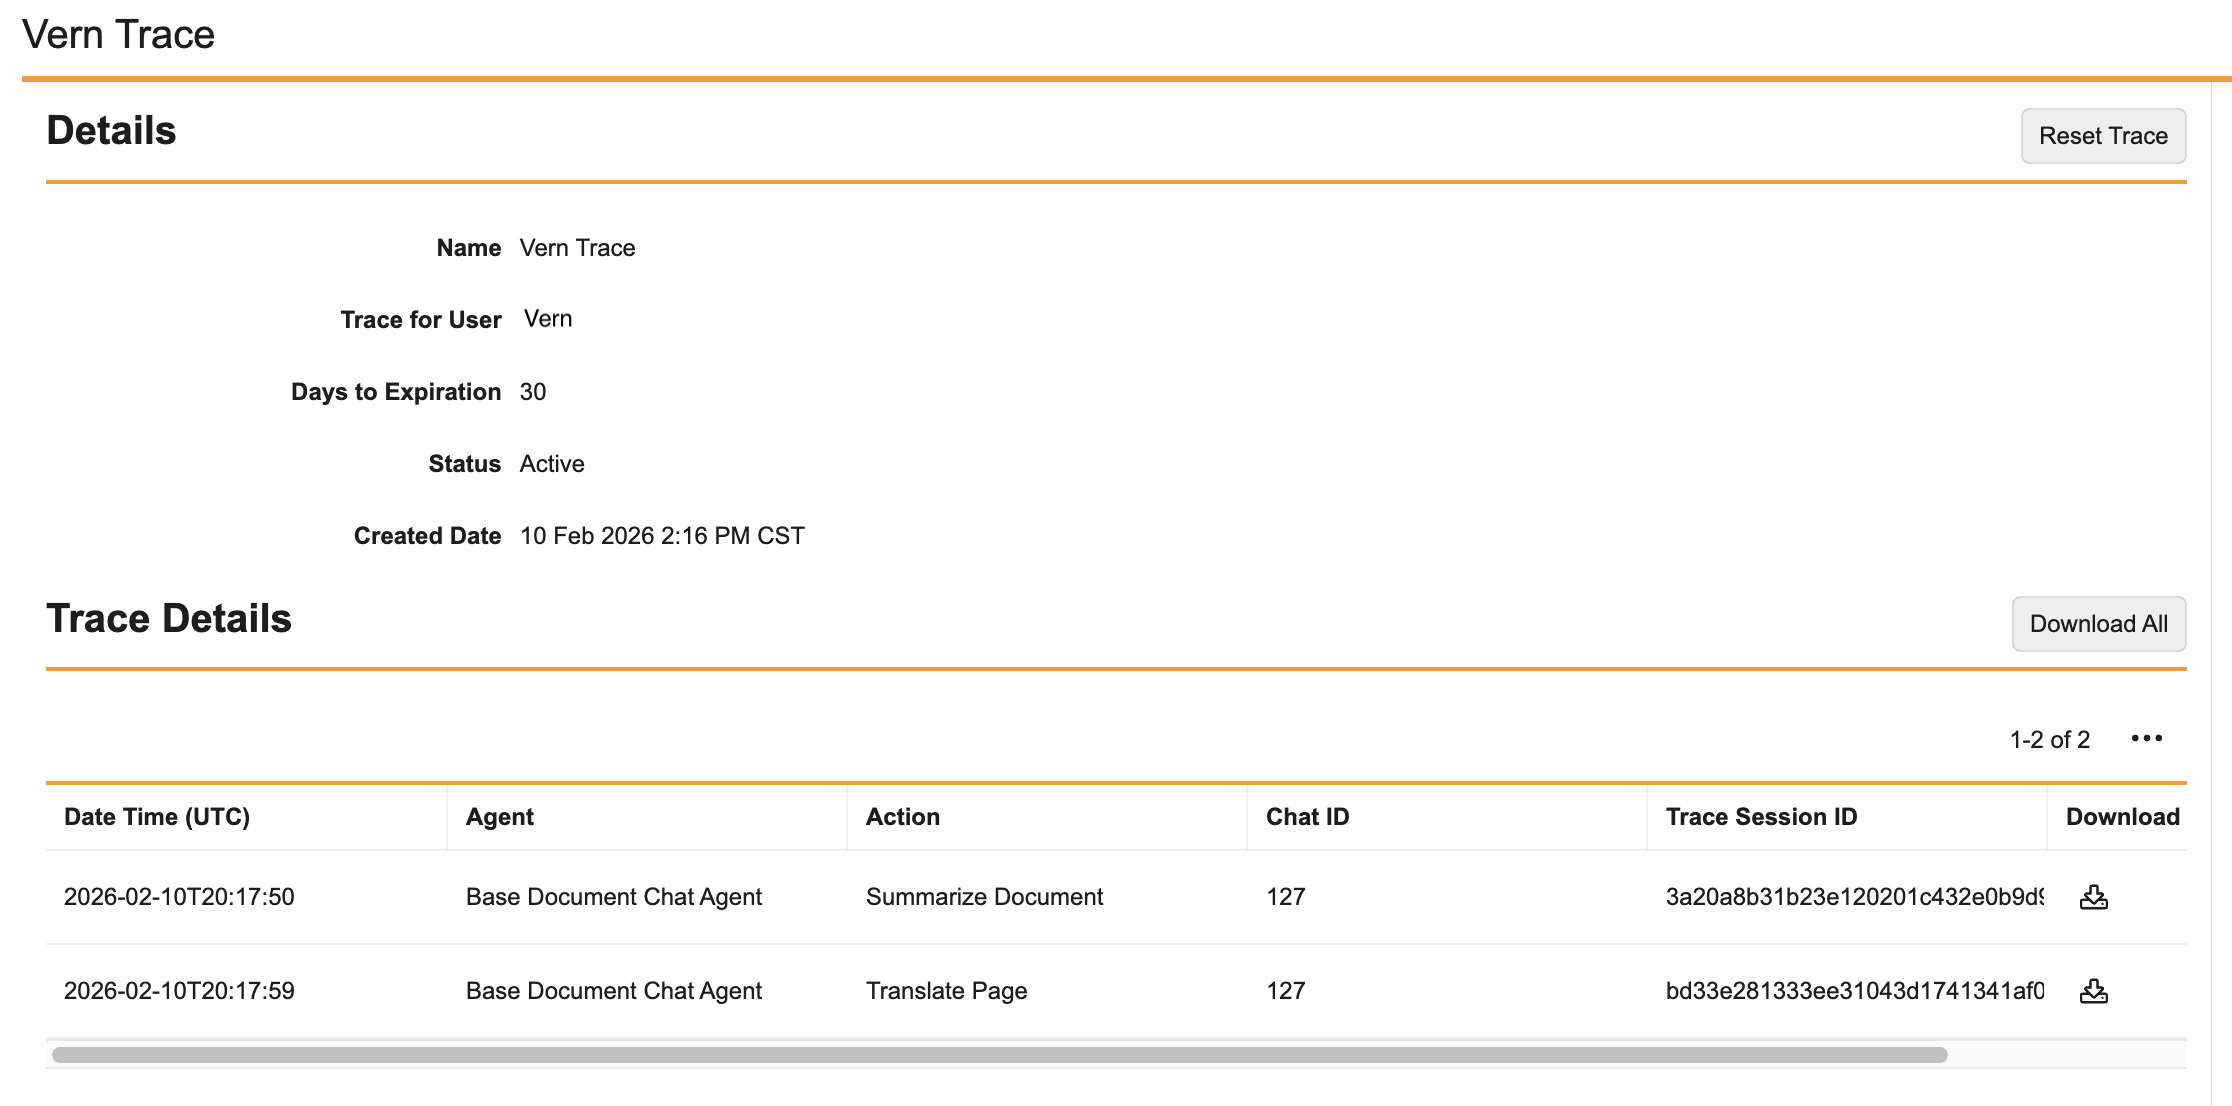
A trace session record is created and active for the selected user. Each time the user executes an agent action, such as through Veeva AI Chat or API, a new log is created under the _Trace Details_ section. Click the icon (<i class="fa fa-download" aria-hidden="true"></i>) in the _Download_ column to download a JSON trace detail file with data on the agent action execution. Click **Download All** to download all agent action traces in one JSON file.

Each trace session is available for 30 days.

<a href="https://platform.veevavault.help/assets/images/25R3.4-trace-logs.png" data-lightbox="images" data-title="" data-alt="Trace Logs">
  <img class="docimage" src="https://platform.veevavault.help/assets/images/25R3.4-trace-logs.png" alt="Trace Logs" style="width: 600px;"  />
</a>

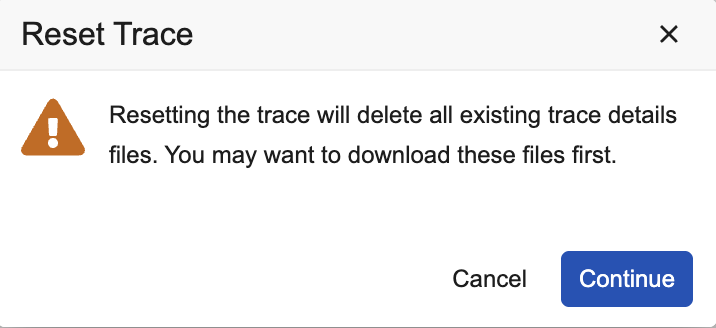
Click **Reset Trace** to erase all logs for the trace session and start over. This action also resets the _Days to Expiration_ back to 30.
<a href="https://platform.veevavault.help/assets/images/reset-trace-dialog.png" data-lightbox="images" data-title="" data-alt="Reset Trace Dialog">
  <img class="docimage" src="https://platform.veevavault.help/assets/images/reset-trace-dialog.png" alt="Reset Trace Dialog" style="width: 400px;"  />
</a>

<div class="note-border alert-info">
  <div class="alert alert-info" role="alert">
    <div><i class="far fa-info-circle"></i></div>
    <div class="alert-text">
      <p><strong>Note</strong>: If you set the <em>Status</em> to <em>Inactive</em>, the trace session stops.</p>
    </div>
  </div>
</div>


#### Limits

Initiating a trace session through the Admin Logs includes the following limitations:

* You can only initiate one trace session per user.
* Up to 20 users can have a trace session initiated.
* Each trace session can trace up to 20 agent actions. In this case, you can click _Reset Trace_ to trace other agent actions.

## Tracking LLM Token Usage

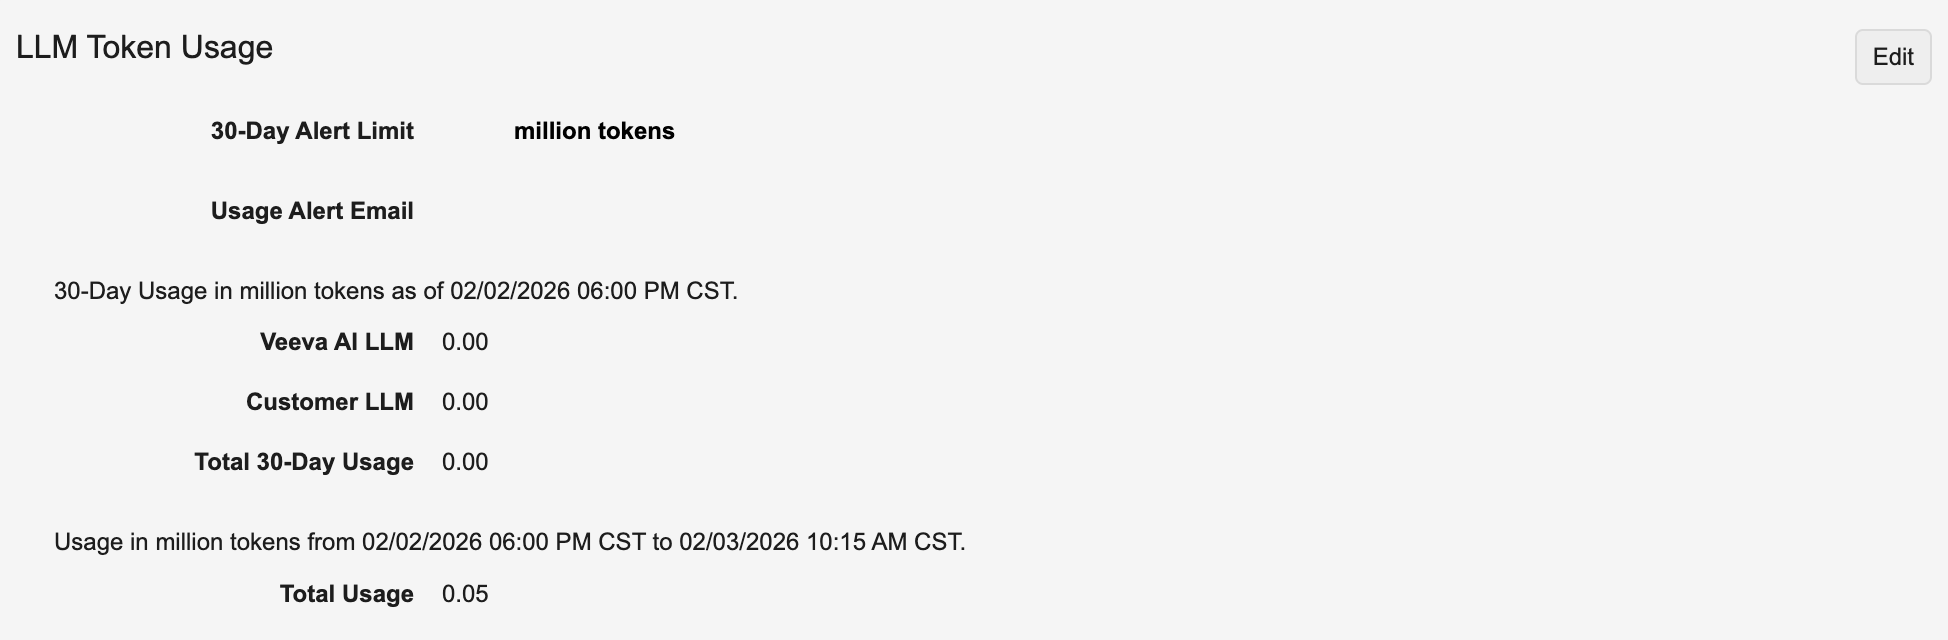
The _LLM Token Usage_ section in **Admin** > **Settings** > **Veeva AI Settings** allows you to enter a maximum 30-day token usage limit in the millions. You can also provide an email to receive alerts when the limit is reached. You can use this information to keep track of and analyze monthly LLM token usage.

Email alerts are sent when the 30-day token usage is greater or equal to:

* 50% of the limit
* 75% of the limit
* 85% of the limit
* 95% of the limit

Vault sends weekly email alerts when token usage equals or is greater than 50%, 75%, or 85% of the 30-day limit. Vault sends a daily alert if the token usage exceeds 95% of the 30-day limit and an hourly alert if token usage exceeds five times the 30-day limit. Vault also sends alerts if a spike in daily token usage is detected in comparison with the daily average of the 30-day limit.

Vault reports token usage using two rounded decimal places. For example, 5,455,000 tokens becomes 5.46 in token usage fields.

<div class="note-border alert-info">
  <div class="alert alert-info" role="alert">
    <div><i class="far fa-info-circle"></i></div>
    <div class="alert-text">
      <p><strong>Note</strong>: Vault evaluates weekly email alerts each Monday and sends the alerts based on the percentage of token usage.</p>
    </div>
  </div>
</div>


### LLM Token Usage Section {#llm-token-usage}

The _LLM Token Usage_ section includes the following fields and sections:

* **30-Day Alert Limit**: The amount of tokens in millions that usage cannot exceed. You can enter this value as an integer with no digits after the decimal place.
* **Usage Alert Email**: Email address that can receive limit alert emails.
* **30 Day Usage in million tokens as of [date and time]**: The total amount of Veeva AI LLM (Veeva AI Basic and Veeva AI Advanced) and custom LLM tokens used in the past 30 days. The date and time value is updated daily at midnight and reflects the UTC time zone.
* **Usage in millions of tokens from [date and time] to [date and time]**: This section reports token usage by the hour on a daily basis. The first date and time reflect midnight of the current day while the second day and time reflect the day and time an hourly job runs to identify the current total LLM token usage.

The total of the _Veeva AI LLM_ and _Customer LLM_ tokens from the past 30 days should match the _Total 30-Day Usage_ tokens.

<a href="https://platform.veevavault.help/assets/images/25R3.4-LLM-Token-Usage-Section.png" data-lightbox="25R3.4-LLM-Token-Usage-Section.png" data-title="" data-alt="LLM Token Usage Section">
  <img class="docimage" src="https://platform.veevavault.help/assets/images/25R3.4-LLM-Token-Usage-Section.png" alt="LLM Token Usage Section" style="width: 800px;"  />
</a>

[0]: #trace-session-veeva-ai-chat
[1]: #trace-session-admin-log